
Fifth Week Reflection

  1. How do external map elements like this pop-up influence the viewing experience? How do you think they could or should be used most effectively?
  2. What choices do you make as map creators that impact the accessibility of your maps for your viewers? What are some concrete examples of accessible features on a web map? What else do you need to keep in mind?
  3. How would you feel about helping someone else learn how to use ArcGIS Online?
  4. What did you find most interesting?
  5. What did you find most frustrating?
  6. What questions do you still have, and what parts of the tool do you want to explore more deeply?

I think that the pop-ups include a lot of information that can be useful for the user. However, it can get overwhelming. Therefore, I believe it is important for them to be used effectively. I do not know the fine details of how, as I am not yet a seasoned user of ArcGIS.

The choices that impact accessibility of my maps include colors and text content. For instance, using appropriate color contrasts and differentiation is essential for web accessibility.

ArcGIS is very high quality and it was fun to learn how to use! So, I would be excited to help someone else learn how to use it as well. I really like how ArcGIS allows users to visualize spatial data in different ways. The UI organizes information well, and there is no lag. There’s also so many buttons to click and so many adjustments that can be made! ArcGIS offers such rich customizability and I always love platforms that do that. I have nothing to complain about. I wonder how to best integrate ArcGIS Online with other tools or platforms—or how to make it work with real-time data.
Fourth Week Reflection

How would you feel about helping someone else learn how to use Omeka? What did you find most interesting? What did you find most frustrating? What questions do you still have, and what parts of the tool do you want to explore more deeply?

Even though I’m not an expert on Omeka, I would still enjoy helping them use it. I think a big part of learning how to use a tool is exploring how to use it, so I would be learning how to use it alongside them. I think it was interesting how we can add tags. I feel like the UI can get a little annoying. I want the ability to hide parts of the Dublin Core because there are way too many identifiers. I wonder what are other creative uses I can utilize Omeka for.

Third Week Reflection

What types of visualizations were you able to generate in Excel using PivotChart? How could those visualizations shape or impact your understanding of the data? Did you generate any visualizations that were confusing or misleading? Alternatively, did you generate any visualizations that were unexpected or illuminating? Additionally, share a screenshot of one of the Pivot Charts you created, featuring a data variable other than the one shared in the example.

There were all kinds of different visualizations that I could generate using PivotChart. Visualization of data definitely helps people understand data faster and at a glance.

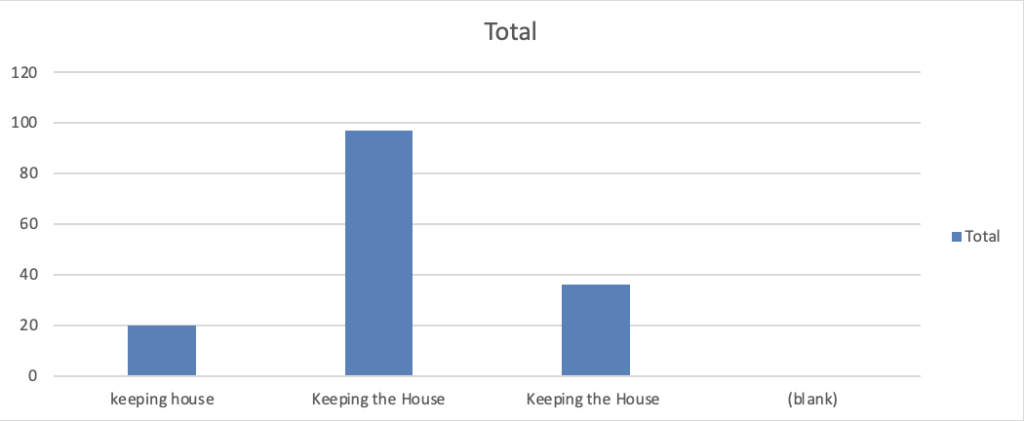
I found it interesting how for the “occupation of female householder” categories, there were only three categories—and all of them were some variation of keeping the house (as seen below). I wonder what “householder” means too—I wasn’t sure if it meant head of household or just a resident.

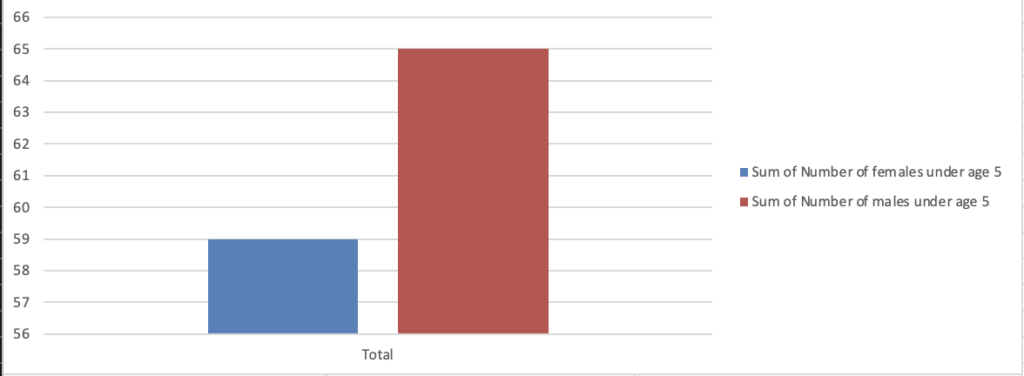
Data visualizations can definitely be misleading if you don’t look at the axis. For example, in the chart below, it seems like there is a huge difference between the number of boys and girls. However, if you look at the axis, you can see it’s not as large as you originally thought.

Second Week Reflection

Reflect on your developing understanding of web accessibility in a blog post on your portfolio site, covering the following questions: something you learned from experience videos, one identified technical feature, one identified conceptual feature, one feature you hadn’t considered before, what errors your portfolio site included (if any) and how you fixed them or are still figuring out how to fix them.

I learned that people can have a hard time clicking on small buttons. Particularly when making a website compatible with mobile, I need to make sure the clickable buttons are large. I also learned that colors with high contrast is important not only for people in general but also for when there’s weird lighting.

A color contrast checker in a web design tool that ensures text and background colors meet accessibility standards can be implemented through design software usage. Writing clear and concise headings to improve readability and navigation for all users have to be considered while creating the content itself. I had not considered ARIA landmarks as a part of web accessibility.

When I ran my website through the WAVE Web Accessibility Tool, it said there was a contrast error, but I really cannot find it. The “error” logo doesn’t even appear on my page. Other than that, there were no errors!

First Week Reflection

What is your reaction to the idea that this job involves learning how to do your job, on the fly?

The idea of learning a job on the fly is definitely intimidating at first, but I also find it really exciting. Not knowing exactly what to expect can be nerve-wracking, but I think it also creates a great opportunity for growth. It forces me to think on my feet, adapt quickly, and develop problem-solving skills in real time. While it might be overwhelming at times, I believe the best way to learn is by doing, and this kind of challenge helps build confidence and resilience.

At the same time, this is exactly what makes the job exciting for me. I love learning new things—it’s one of the main reasons I applied to be a Vivero Fellow. Getting hands-on experience and figuring things out as I go is something I really enjoy. Instead of seeing this uncertainty as a drawback, I see it as an opportunity to develop new skills and push myself in ways I wouldn’t otherwise.